
August 27, 2021
|
7
minute read
Retail and ecommerce statistics that actually matter in 2026

The retail industry runs on benchmarks. The problem is most of the statistics circulating in blog posts and boardroom decks are outdated, decontextualised, or both. This post covers the numbers that should actually inform how you allocate budget, build your retention strategy, and measure success in 2026.
The economics of customer retention vs acquisition
Acquiring a new customer costs five times more than retaining an existing one. That's not new information, but what has shifted is the urgency. With digital advertising costs continuing to rise and customer acquisition cost (CAC) now averaging between $127 and $462 depending on your category, the brands that grow profitably are the ones winning on retention.
The probability of selling to an existing customer is 60–70%. The probability of selling to a new prospect is 5–20%. That gap should dictate where your marketing spend goes.
A 5% increase in customer retention correlates with a 25–95% increase in profitability, according to the Yotpo State of Brand Loyalty analysis. The range is wide because it depends on your margin structure, but even the low end of that figure makes the case for a retention-first strategy.
The benchmark most worth tracking is your LTV:CAC ratio. A healthy ratio sits above 3:1, meaning a customer generates three times the revenue it cost to acquire them. If your ratio is below that, you're acquiring customers who don't stay long enough to be profitable.

How repeat purchase rate varies by retail category
Not all repeat rates are equal. Understanding your category benchmark matters before you set targets.
Industry data puts typical repeat purchase rates roughly as follows: apparel sits around 20–26%, beauty is similar but can exceed 40% for brands with strong replenishment cycles, and electronics trails lower due to longer product lifecycles.
The apparel benchmark is particularly relevant for mid-market Australian retailers. If your repeat rate is sitting below 20%, you have a structural problem, either in your post-purchase communication, your loyalty mechanics, or both.
Separately, 65% of revenue across ecommerce brands comes from repeat customers. If your revenue mix skews heavily toward new customers, your business model is more dependent on acquisition spend than it needs to be.

What personalisation is worth in practical terms
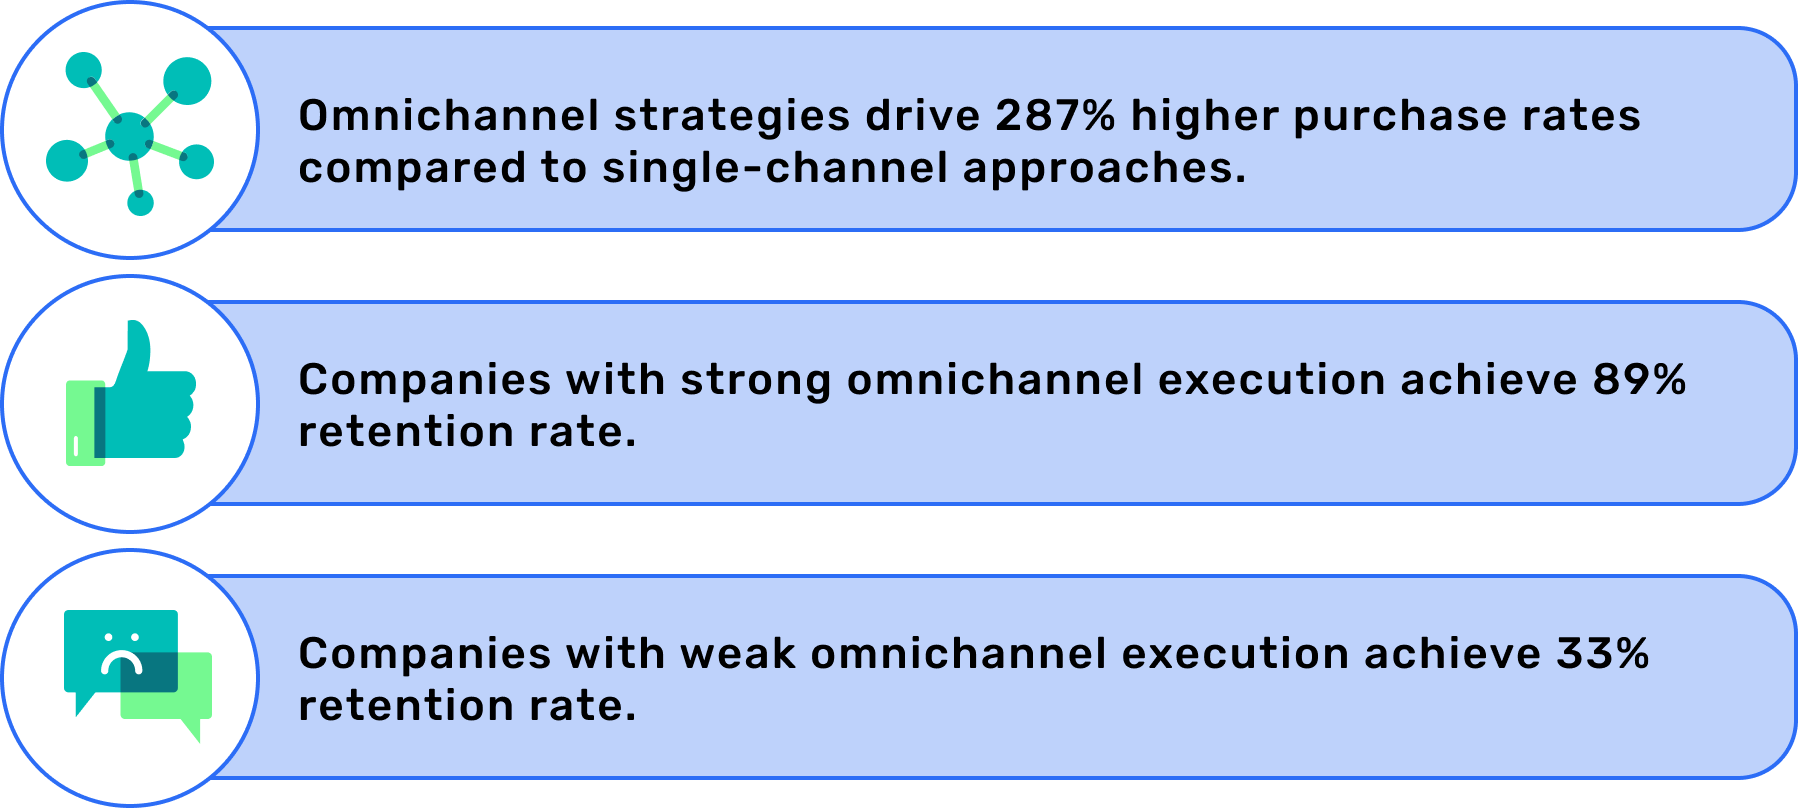
Omnichannel strategies drive 287% higher purchase rates compared to single-channel approaches, and companies with strong omnichannel execution achieve 89% customer retention rates versus 33% for brands with weaker cross-channel strategies (Envive.ai, 2025). Personalisation is the mechanism that makes omnichannel strategies work, without relevant messaging, cross-channel presence is just noise.
For retail specifically, this plays out in triggered campaigns. Abandoned cart emails with personalised product references consistently outperform generic recovery messages. Post-purchase sequences timed to a customer's individual repurchase window outperform batch-and-blast promotional emails. The lift shows up directly in repeat rate and LTV.
This is where a customer segmentation platform becomes the practical tool behind the strategy. You can't personalise at scale without first knowing which segment each customer belongs to and what their likely next behaviour is.
The loyalty programme reality check
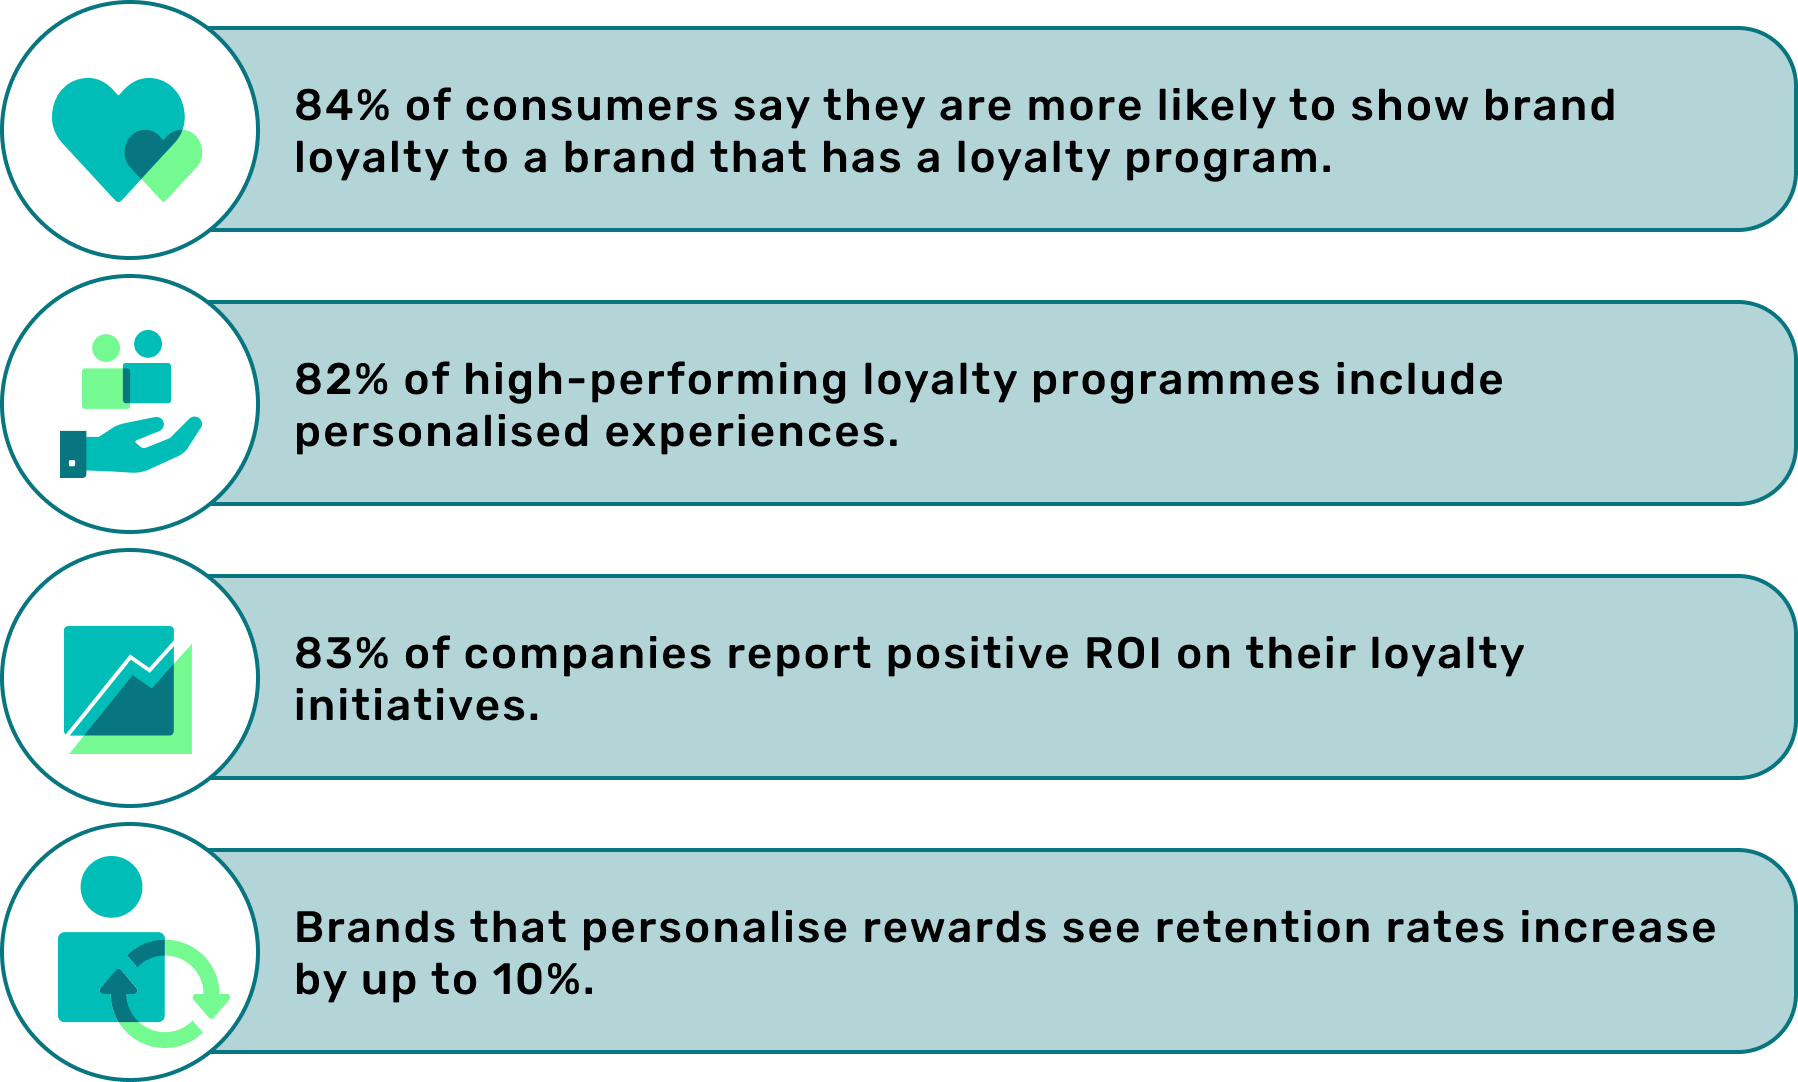
84% of consumers say they're more likely to stay loyal to a brand that offers a loyalty programme, and 83% of companies report positive ROI on their loyalty initiatives (Venn Apps, 2025). But programme design matters enormously, as points for purchases alone don't build the kind of loyalty that drives LTV.
The programmes that outperform are those that reward meaningful behaviour, not just spend. Tiered structures work because they give customers something to work toward. The "almost at Gold" effect drives behaviour in a way flat discounts don't. Brands that personalise rewards see retention rates rise by up to 10%, and 82% of high-performing loyalty programmes include personalised experiences (Venn Apps, 2025).
Sephora's Beauty Insider programme is the most-cited retail loyalty benchmark: over 25 million members who account for roughly 80% of total sales, with members spending three times more than non-members (Mobiloud, 2025). The mechanism is that the programme makes customers feel seen.
For mid-market retailers, the equivalent isn't necessarily a points system. It's using behavioural data to identify your top customers and treating them demonstrably differently: priority access, early communications, service that acknowledges their history with your brand. That requires unified customer profiles, as you can't deliver that experience if your purchase history, loyalty data, and service records all live in separate systems.
Your highest-value customers are more concentrated than your averages suggest
The most valuable analysis you can run isn't about averages — it's about understanding what your highest-value customers look like, where they came from, and what makes them stay.
Lookalike audiences built from first-party customer data consistently outperform third-party interest targeting, and that performance gap has widened as signal loss from cookie deprecation has reduced the effectiveness of third-party data. Brands that identify their best-customer characteristics and use that profile to guide acquisition spend get more from the same budget.
A retail CDP solution makes this operationally straightforward: you can identify your best customers, model their characteristics, and build acquisition audiences from first-party data rather than demographic proxies.
The cost of doing nothing on AI-driven search
Global ecommerce sales are projected to reach $6.42 trillion in 2025 (Elementor, 2026). The channel through which customers discover products is changing at the same rate as the overall market growth.
AI-generated answers in ChatGPT, Perplexity, and Google's AI Overviews are increasingly the first point of contact between a shopper and a brand recommendation. Brands without content structured to answer specific retail questions — with clear, citable answers and current data — are invisible in those results regardless of their search ranking.
Structured data (schema markup) is now a prerequisite. Product, Offer, and return policy schema across your entire catalogue is how you show up in AI-generated shopping recommendations.
FAQs
What statistics should a retail CMO track in 2026?
Focus on LTV:CAC ratio (target above 3:1), repeat purchase rate benchmarked to your category, overall retention rate, and the split between new vs repeat customer revenue. These four metrics tell you whether your customer base is structurally healthy or whether you're dependent on acquisition spend to sustain revenue.
What is the average repeat purchase rate for retail ecommerce?
Benchmarks vary by category. Apparel typically sits at 20–26%, beauty at a similar level with higher potential for brands with replenishment products, and electronics lower due to longer product lifecycles (Bluecore / Mobiloud, 2025). If you're below your category average, post-purchase communication and loyalty mechanics are the first places to investigate.
What is a healthy LTV to CAC ratio for retail?
A 3:1 ratio is the standard benchmark — a customer generates three times the revenue it cost to acquire them (Shopify, 2025). Below 3:1 signals that acquisition spend isn't producing sustainable returns and that retention investment is likely underweighted.
How do omnichannel retailers outperform single-channel brands?
Companies with strong omnichannel execution achieve 89% customer retention rates versus 33% for brands with weak cross-channel strategies, equating to 287% higher purchase rates (Envive.ai, 2025). The difference is usually data: omnichannel brands have a unified view of each customer's behaviour across every channel, which single-channel brands can't match.
What percentage of revenue comes from repeat customers?
Across ecommerce, repeat customers account for approximately 65% of revenue (Envive.ai, 2025). If your revenue split is weighted toward new customers, you're paying acquisition costs repeatedly for customers who should already be in your base.